Bike Sales Analysis
Objective
To analyse customer demographics and attributes, along with their bike purchase behaviour.
Dataset Summary
The dataset comprises approximately 1,000 survey records containing details about customer demographics and their bike purchase status. It also includes home ownership, car count, commute distance, and number of children.
Process
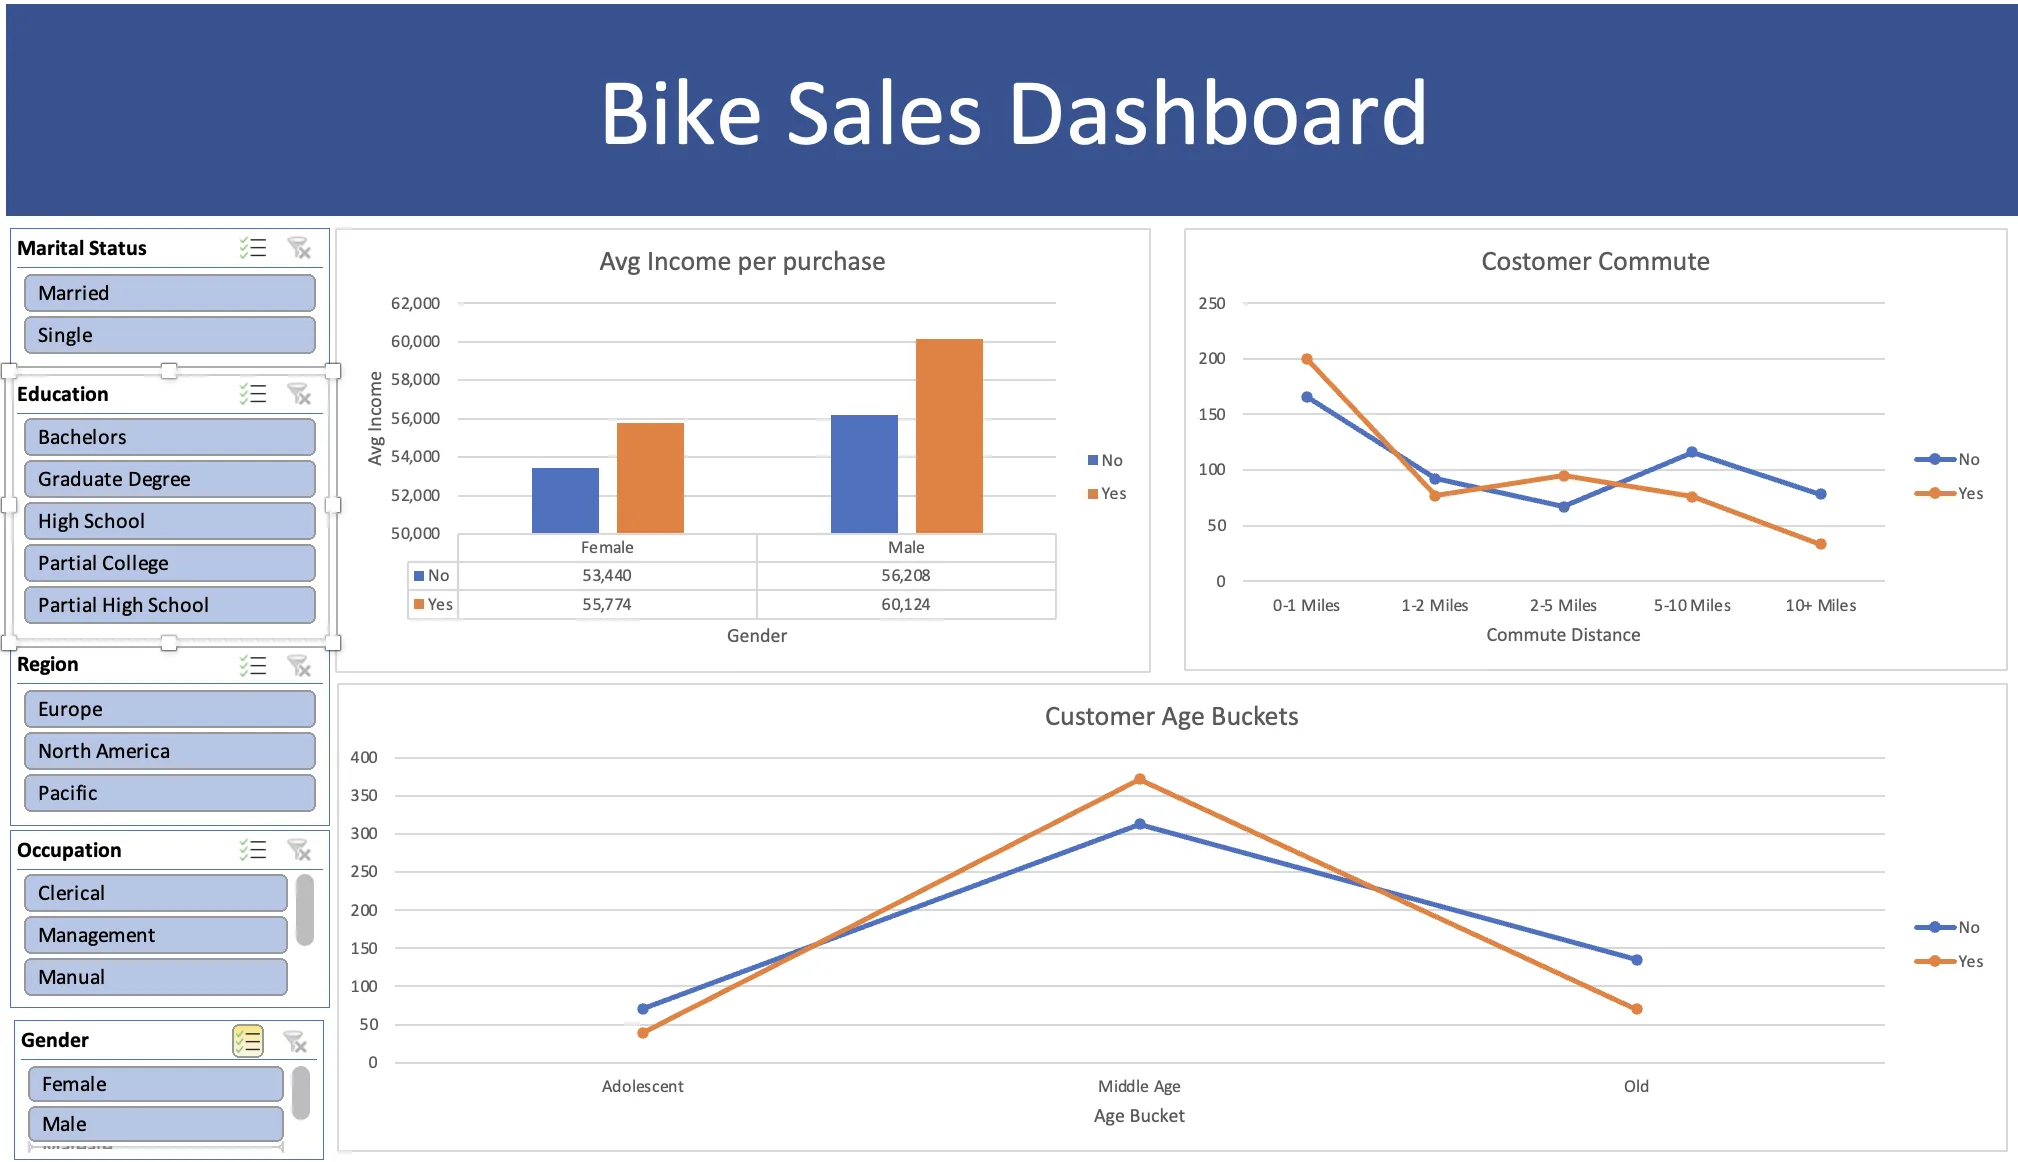
The process included analysing the data in Excel. Multiple pivot charts were created from which a dashboard was built. To slice data at various cuts, multiple slicers were put in place.
Key Insights
- More males purchase bikes than females (56% vs 52%).
- Average income of males purchasing bikes is ~8% higher than females. A clear income gap exists between buyers and non-buyers in both genders.
- Middle-age users buy more bikes than adolescent and older users; this share is higher in females than males.
- In the Pacific region, shorter commute correlates with higher bike purchases - but this pattern does not hold in America and Europe.
Graphs
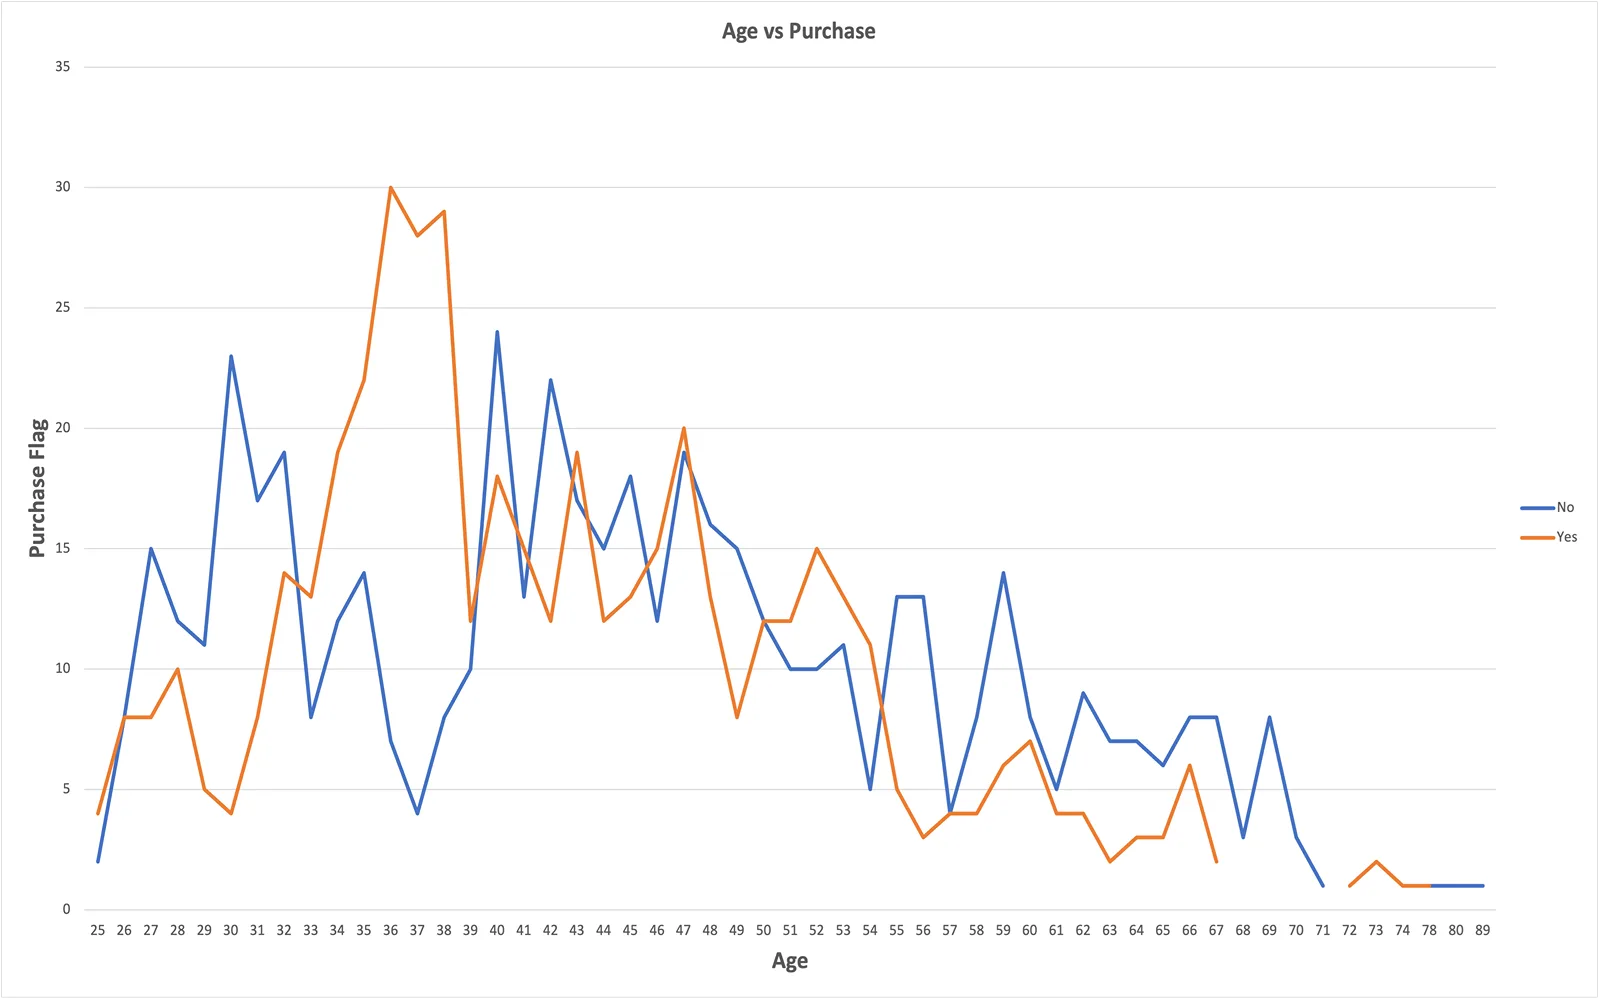
Age vs Purchase
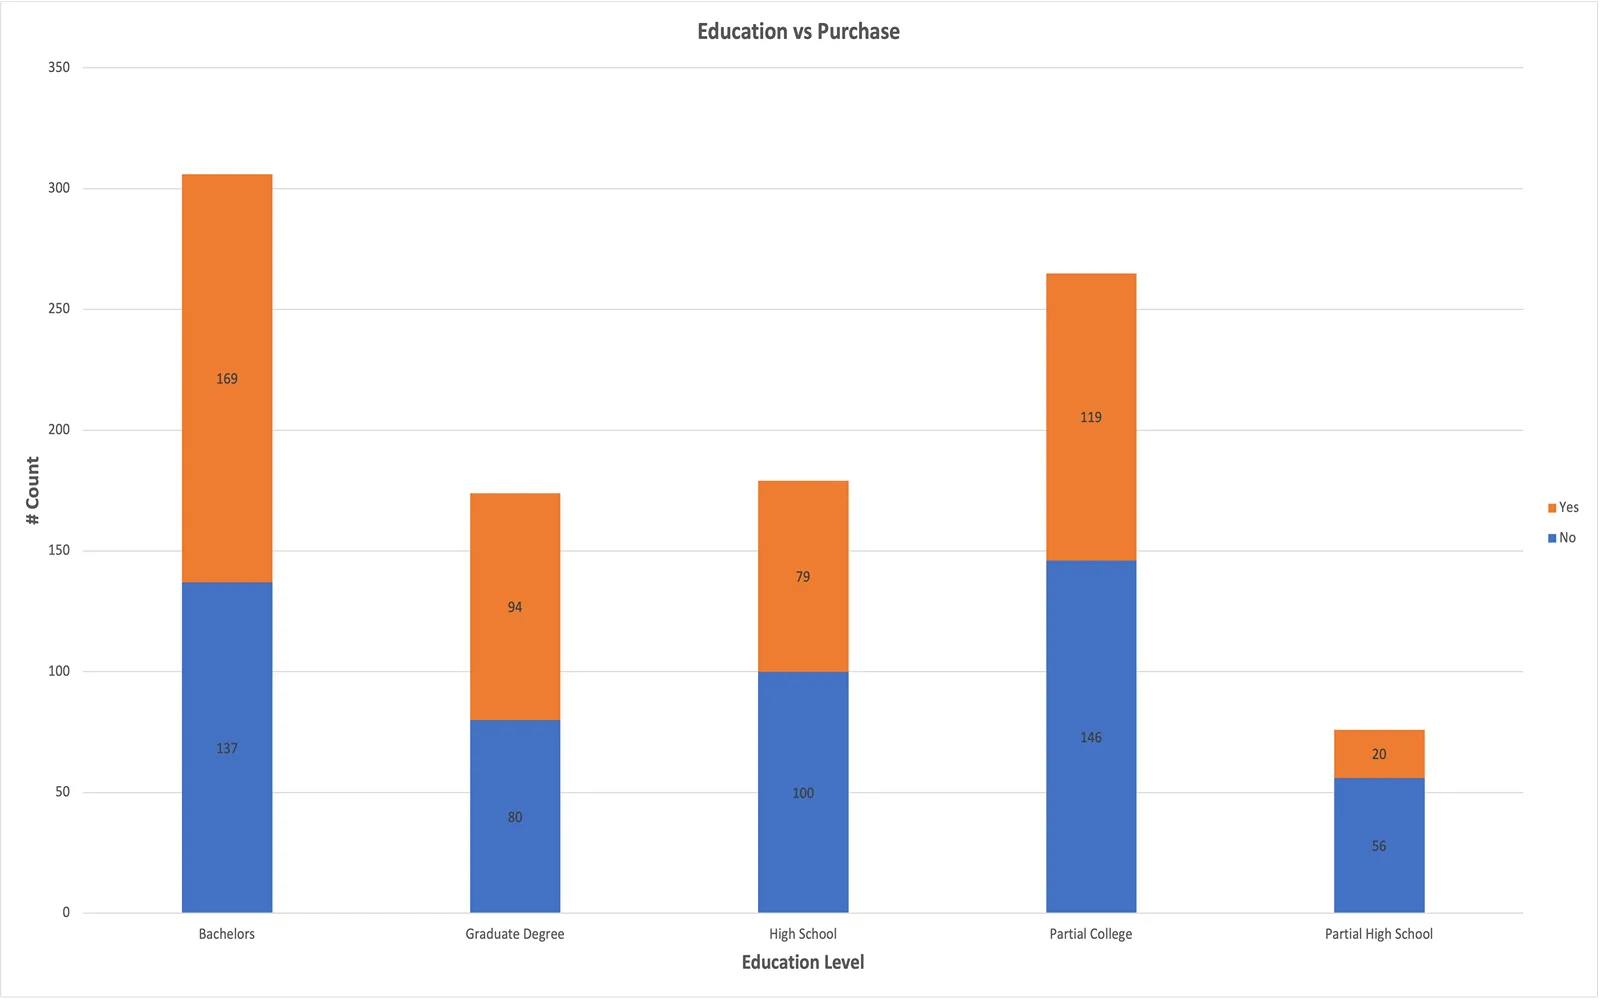
Education Level vs Purchase
Excel Dashboard