E-commerce Sales Analysis
Objective
To identify trends and patterns in sales, KPIs, and customer behaviour across products and regions of an e-commerce website.
Dataset Summary
The data includes orders across months and states, covering product categories, payment modes, order statuses, and order counts. It provides insights into purchasing trends and customer behaviour across regions.
Process
Data was analysed in Excel using pivot charts to build an order-contribution dashboard. A second dynamic KPI dashboard was built without pivot tables using SUMIFS formulas, enabling fully flexible filtering.
Key Insights
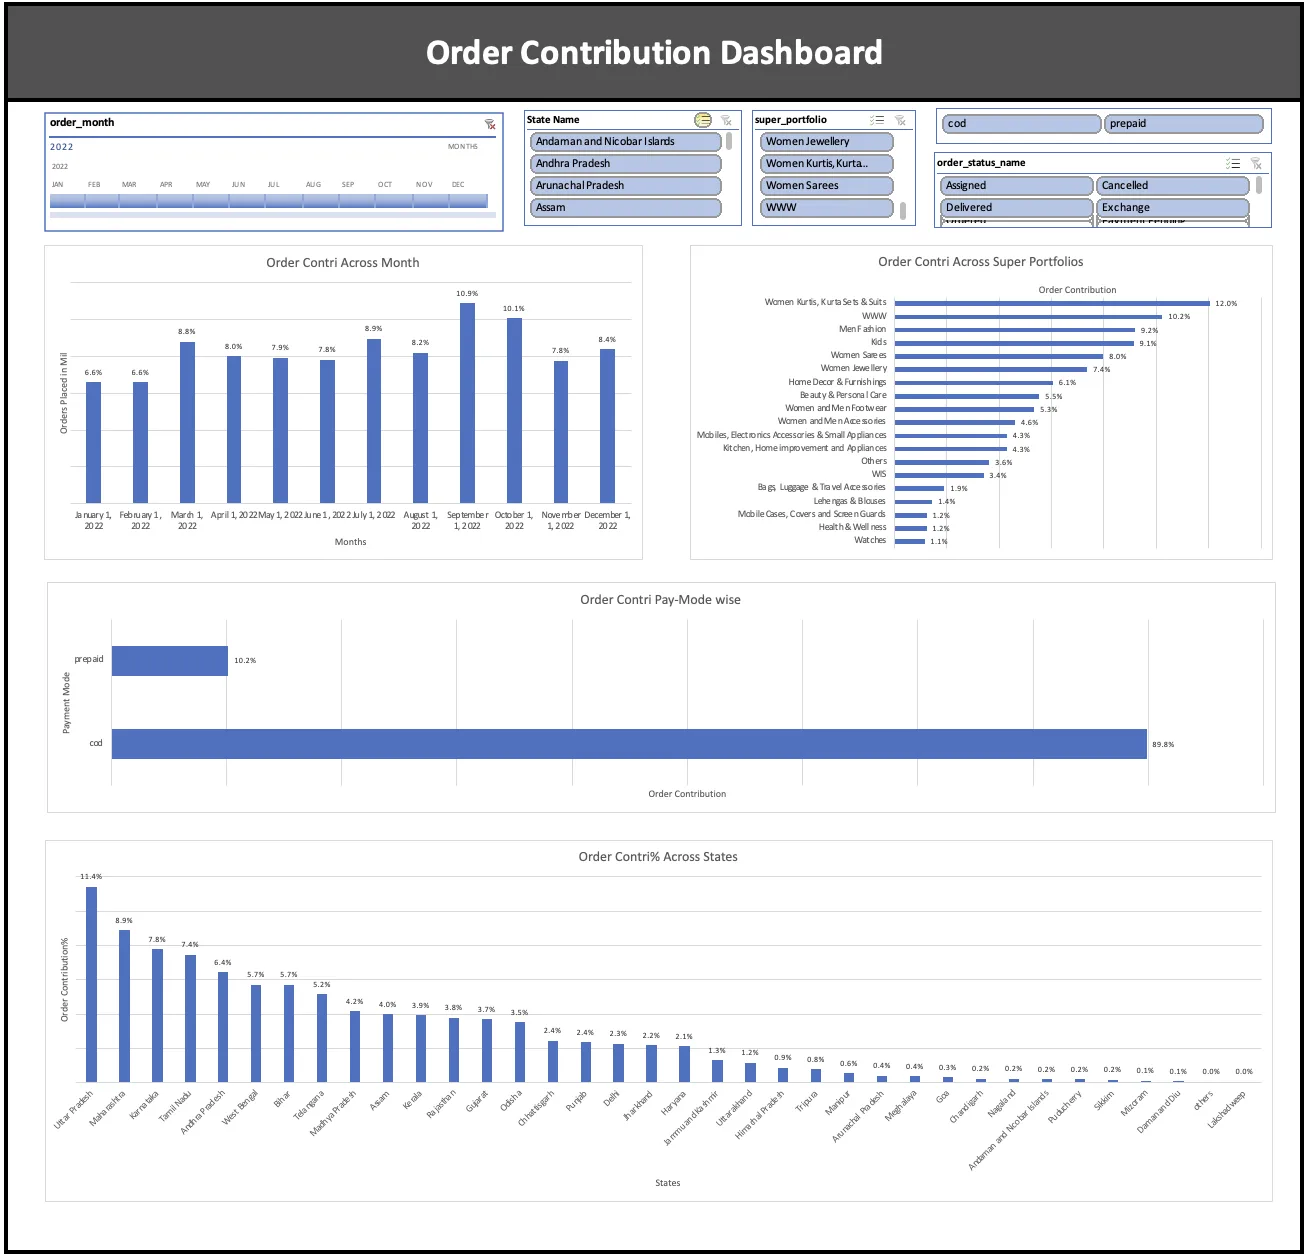
- September and October were the highest-order months due to the festive season (~21% combined).
- Women Kurtis and Kurta Sets is the biggest category (12%), followed by Women Western Wear (10%) and Men's Fashion (9%).
- ~90% of orders use COD; only 10% are prepaid. Prepaid share rises during the festive season.
- Uttar Pradesh is the highest-grossing state (11.5%), followed by Maharashtra (9%) and Karnataka (7.8%).
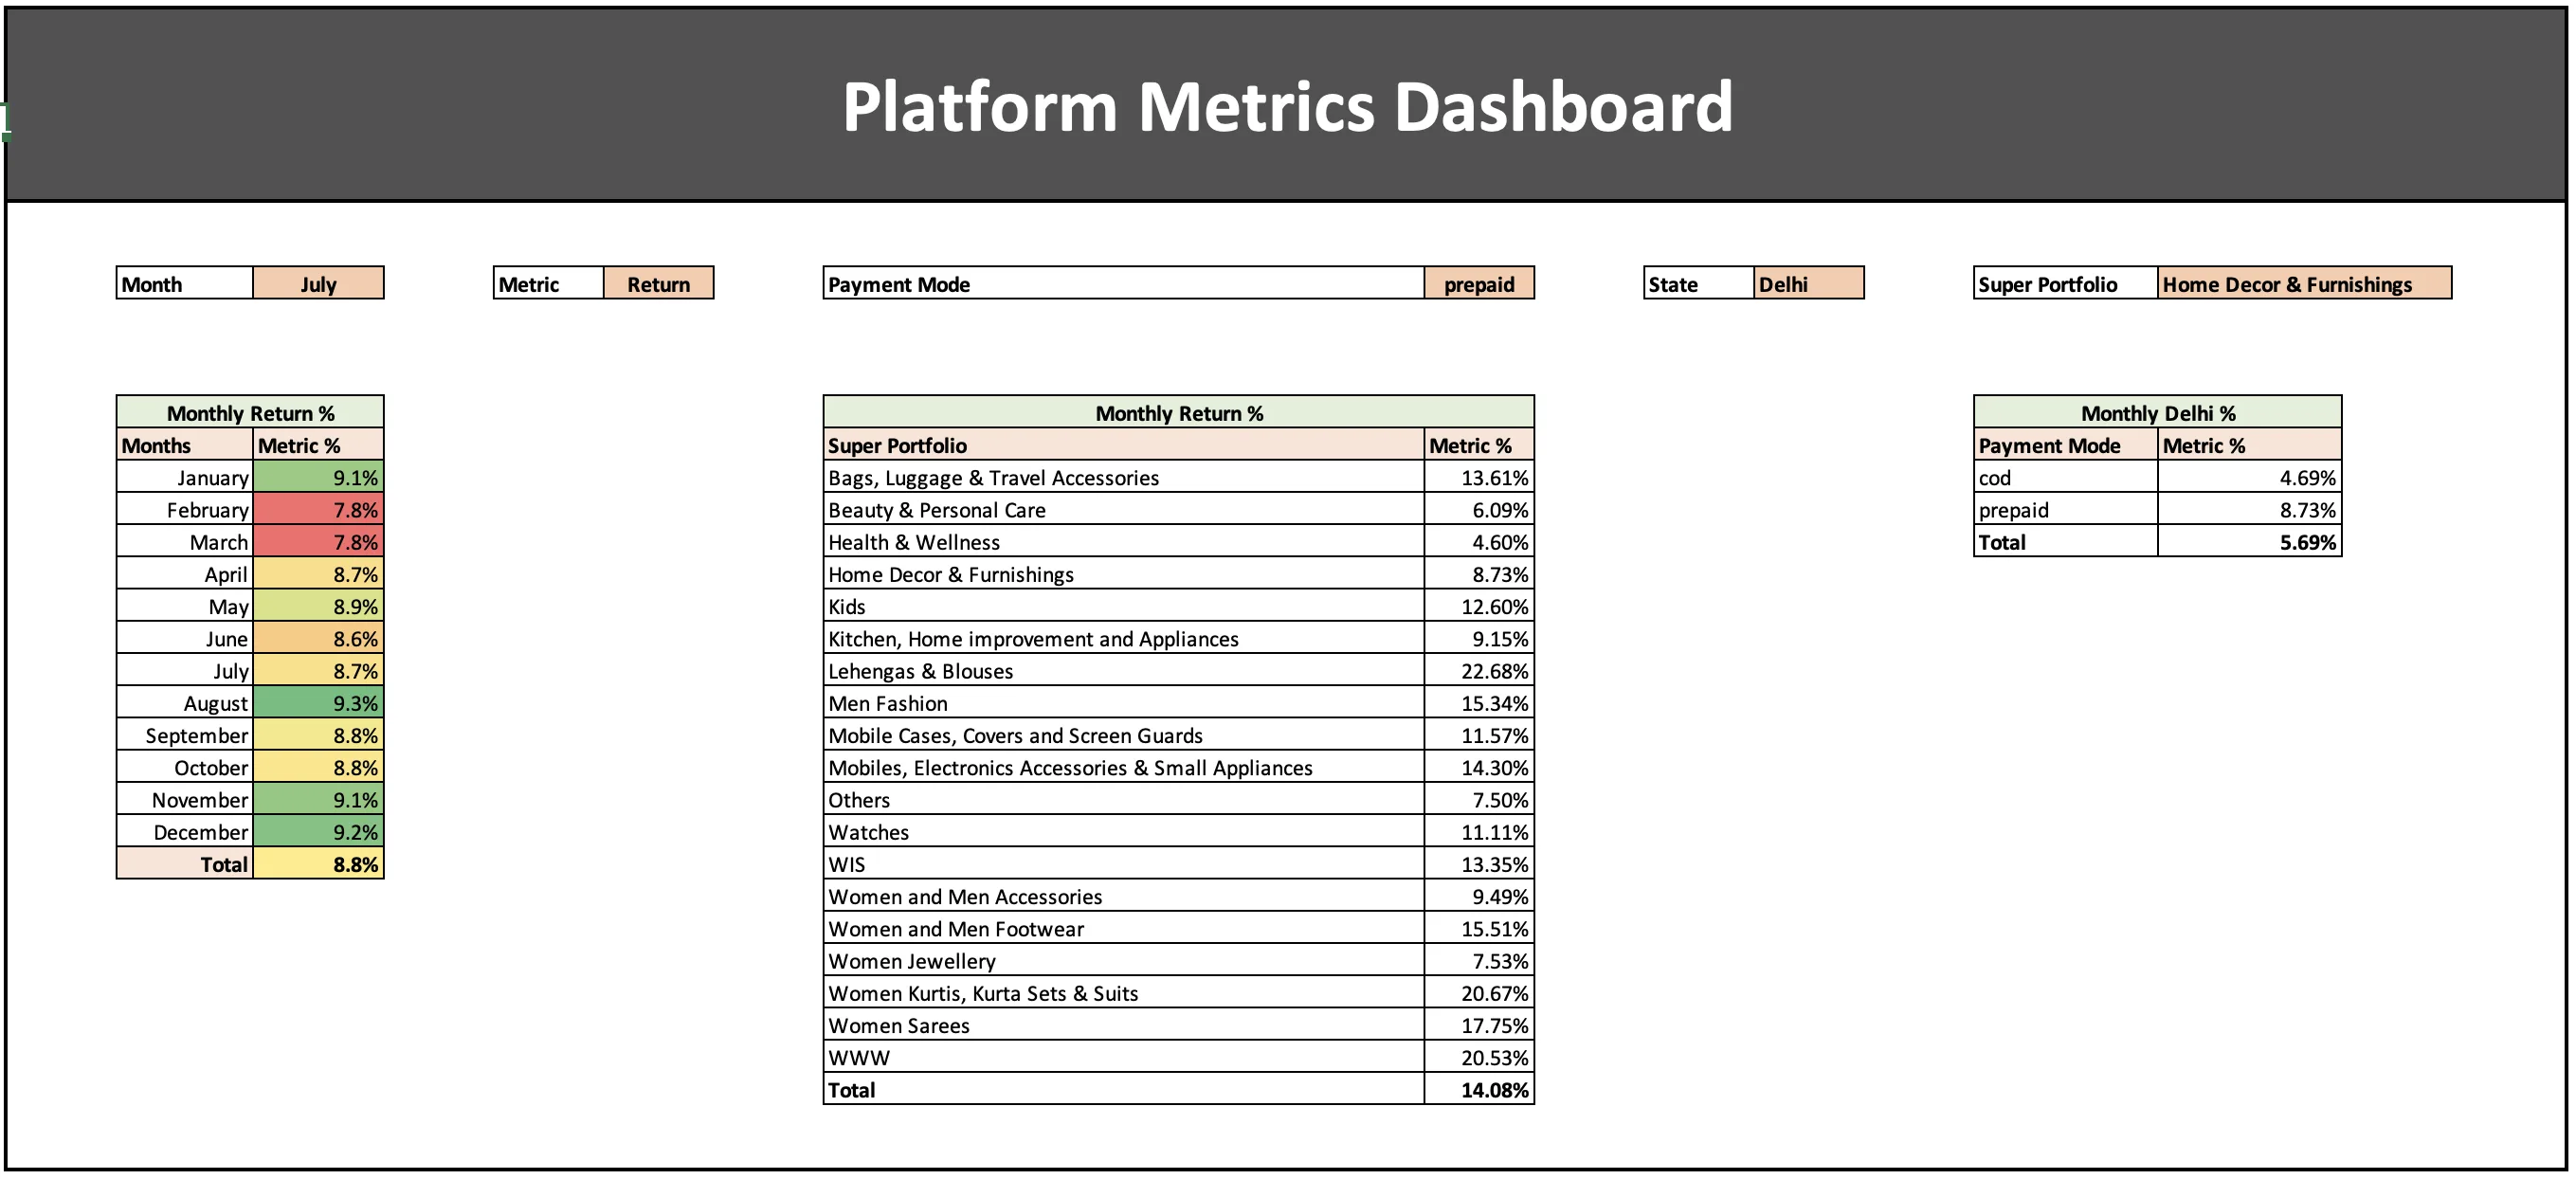
- Prepaid metrics consistently outperform COD - RTO 2% vs 15%, Delivered 58% vs 55%, Cancellation 20% vs 19%.
Snapshots
Order Contribution Dashboard
Metrics Dashboard