Instacart Customer Analysis
Objective
Gain insights into the purchasing patterns of Instacart users, including frequency and items bought.
Dataset Summary
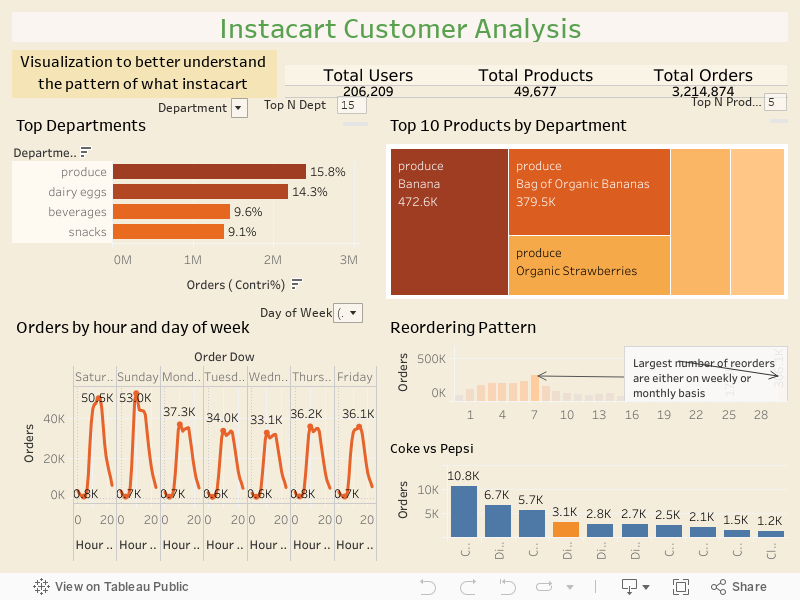
- Aisles and Departments: There are 134 unique aisles and 21 unique departments, categorizing the products.
- Orders and Users: A total of 3.4M orders have been placed by ~200K users, indicating substantial user engagement.
- Products: The dataset includes ~50k products categorized by aisle and department.
- User Information: Additional user data includes order day, order hour, days since last order, and reorder flags.
Process
The process included uploading multiple files into Python, forming a dictionary of dataframes, merging them into a unified dataset. These dataframes were then imported into a SQL server for querying and exploring insights. Extracted valuable information was exported and loaded into Tableau for visualization purposes.
Key Insights
- Produce and Dairy & Eggs are clear winners in terms of orders and reorder ratio within departments.
- Fresh fruits and vegetables have very high reorder rates compared to packaged equivalents.
- Saturday afternoons and Sunday mornings are prime time for orders.
- Reordering Pattern: Most reorders happen on the 7th, 14th, 21st, and 30th day - clear weekly and monthly spikes.
- Coke vs Pepsi: Coke is the clear winner.
Graphs
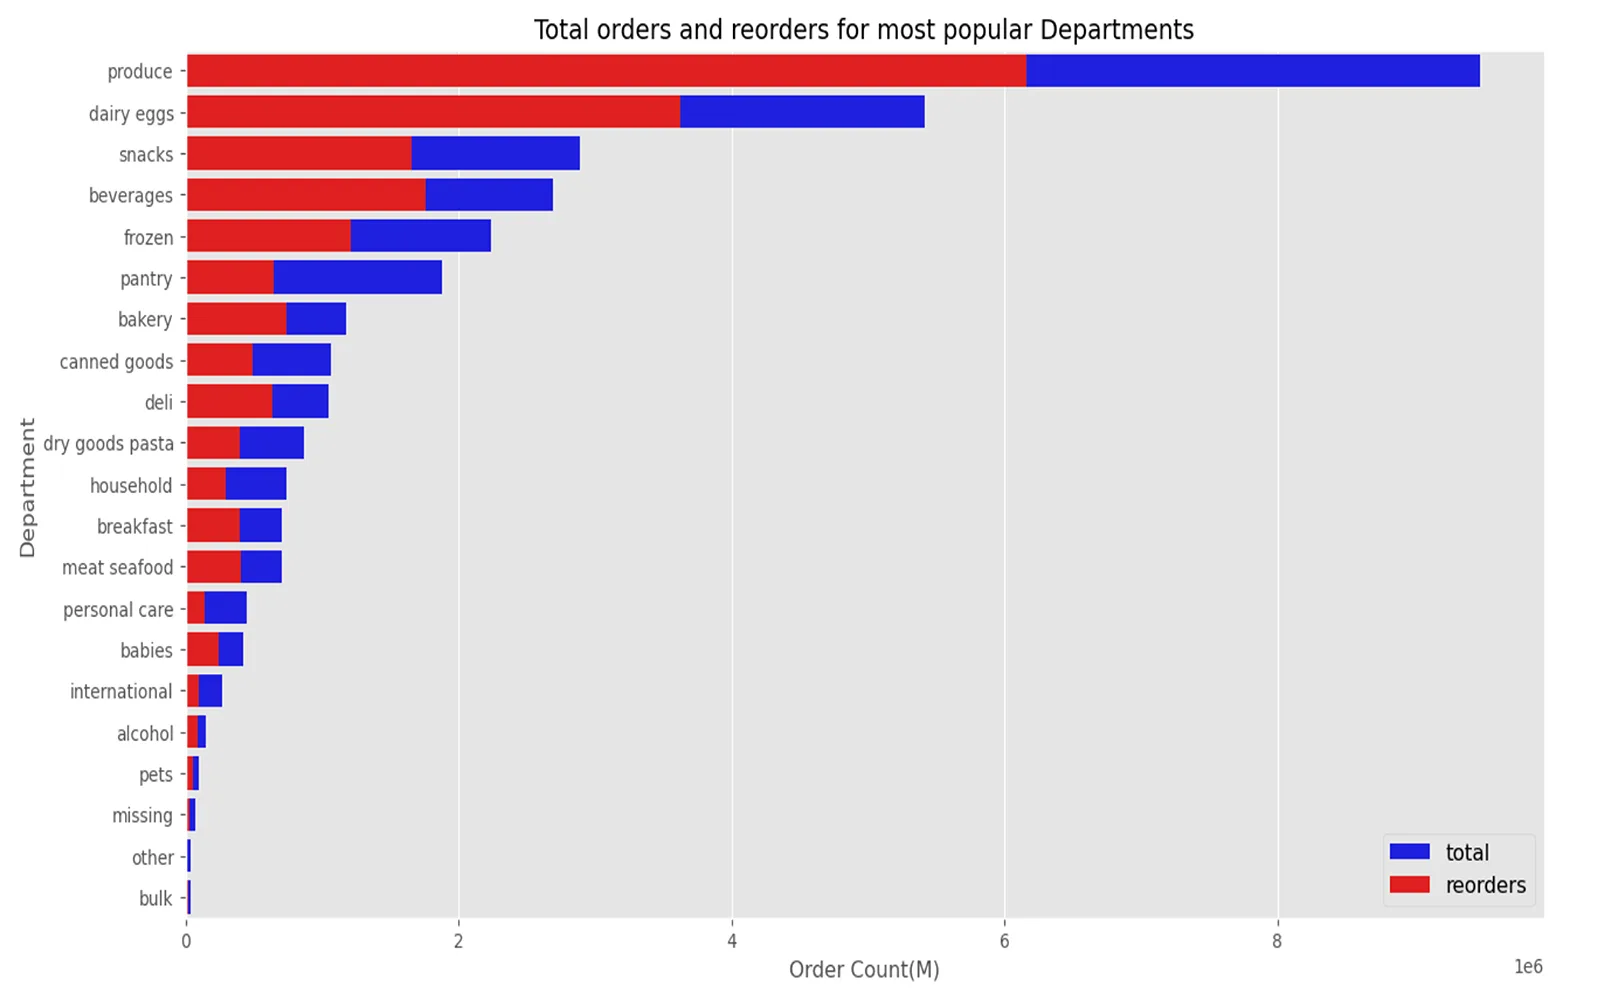
Departmental Orders
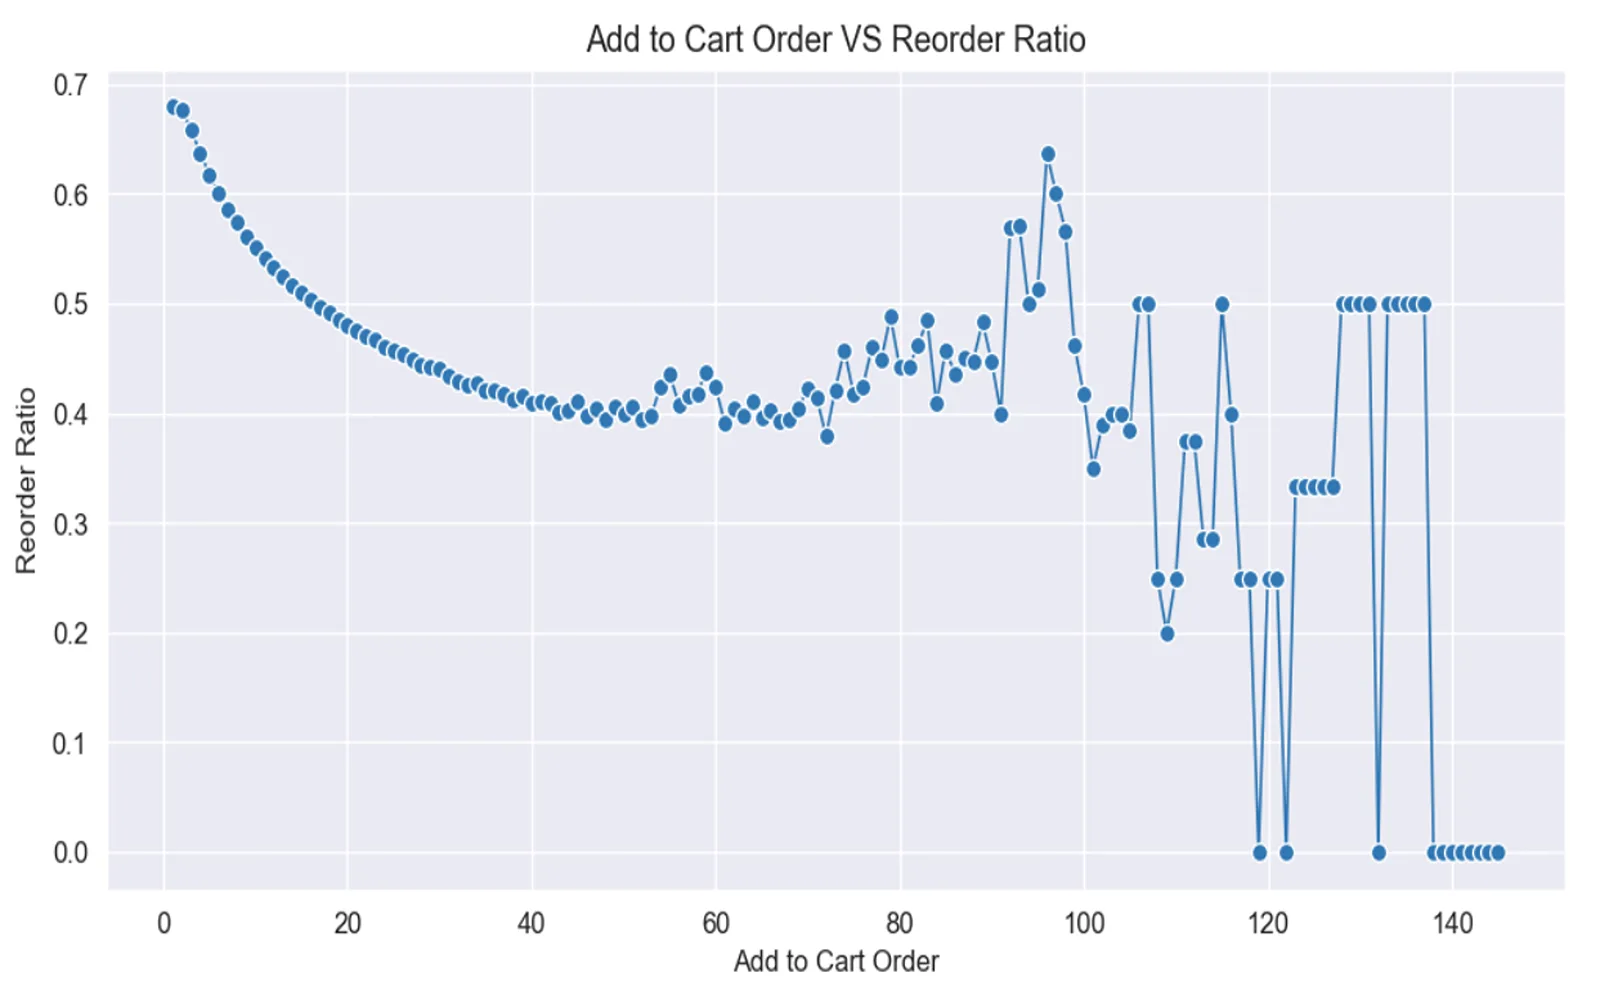
ATC vs Reorder
Tableau Dashboard