Roller Coaster EDA
Objective
Analyse and establish relationships between features of roller coasters across the USA.
Dataset Summary
The dataset contains information about ~1,200 roller coasters across the USA, including height, speed, number of inversions, year of establishment, and more.
Process
Exploratory data analysis was performed using Python by plotting charts at multiple cuts. Feature correlations were established using a correlation heatmap.
Key Insights
- Most roller coasters were introduced in 1999 and 2000.
- The frequency distribution of speed shows most coasters fall in the 40–60 mph range.
- There is a direct positive correlation between height and speed. Newer coasters also tend to be faster than earlier ones.
Graphs
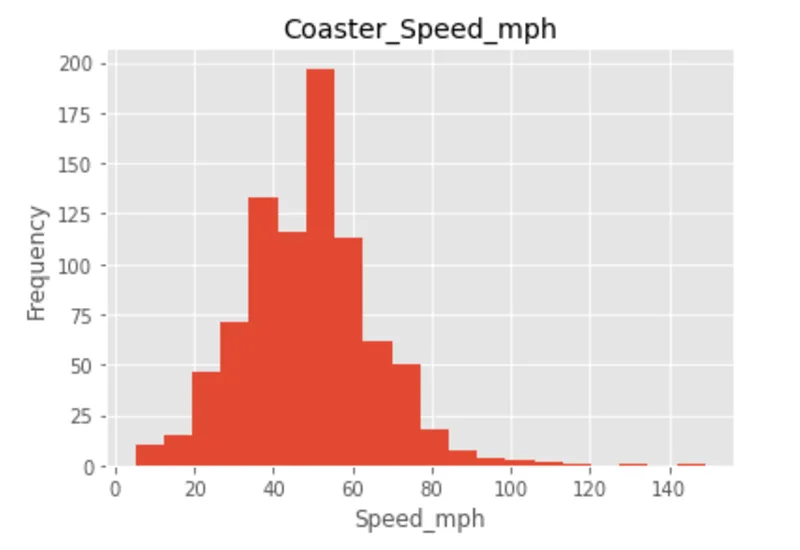
Frequency Distribution of Speed
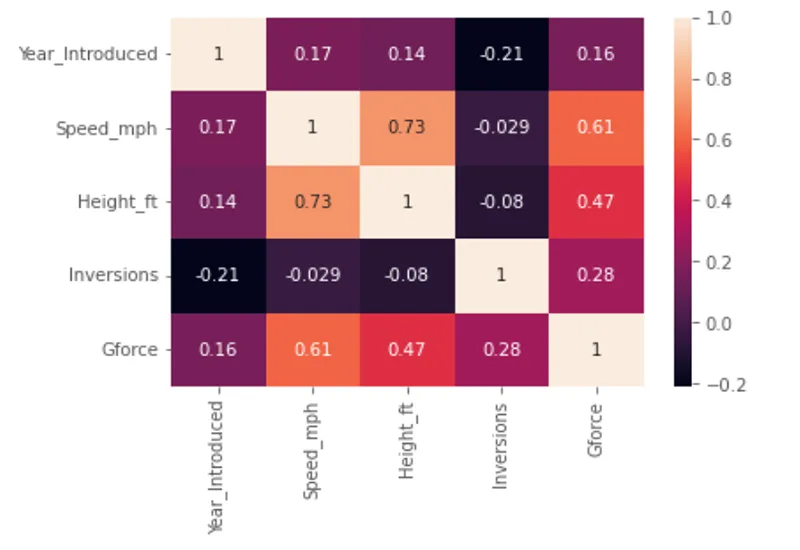
Features Correlation Matrix