Personal Details
IIT BHU graduate. Analytical by training, strategic by instinct. The story behind the work.
Staff Analyst turning raw data into revenue, efficiency, and growth. Now building at the intersection of analytics and AI.

IIT BHU graduate. Analytical by training, strategic by instinct. The story behind the work.

Senior Data Analyst across Meesho, OLA, and Myntra. Building analytics systems that drove product, operations, and growth decisions at scale.
Technical tools and business capabilities I bring to every engagement.
Real problems. Real data. Real outcomes. Each project shows how I translate data into business decisions.

SQL financial reconciliation uncovering a €19,500 revenue gap and a Looker Studio ops dashboard for a Berlin skincare startup.
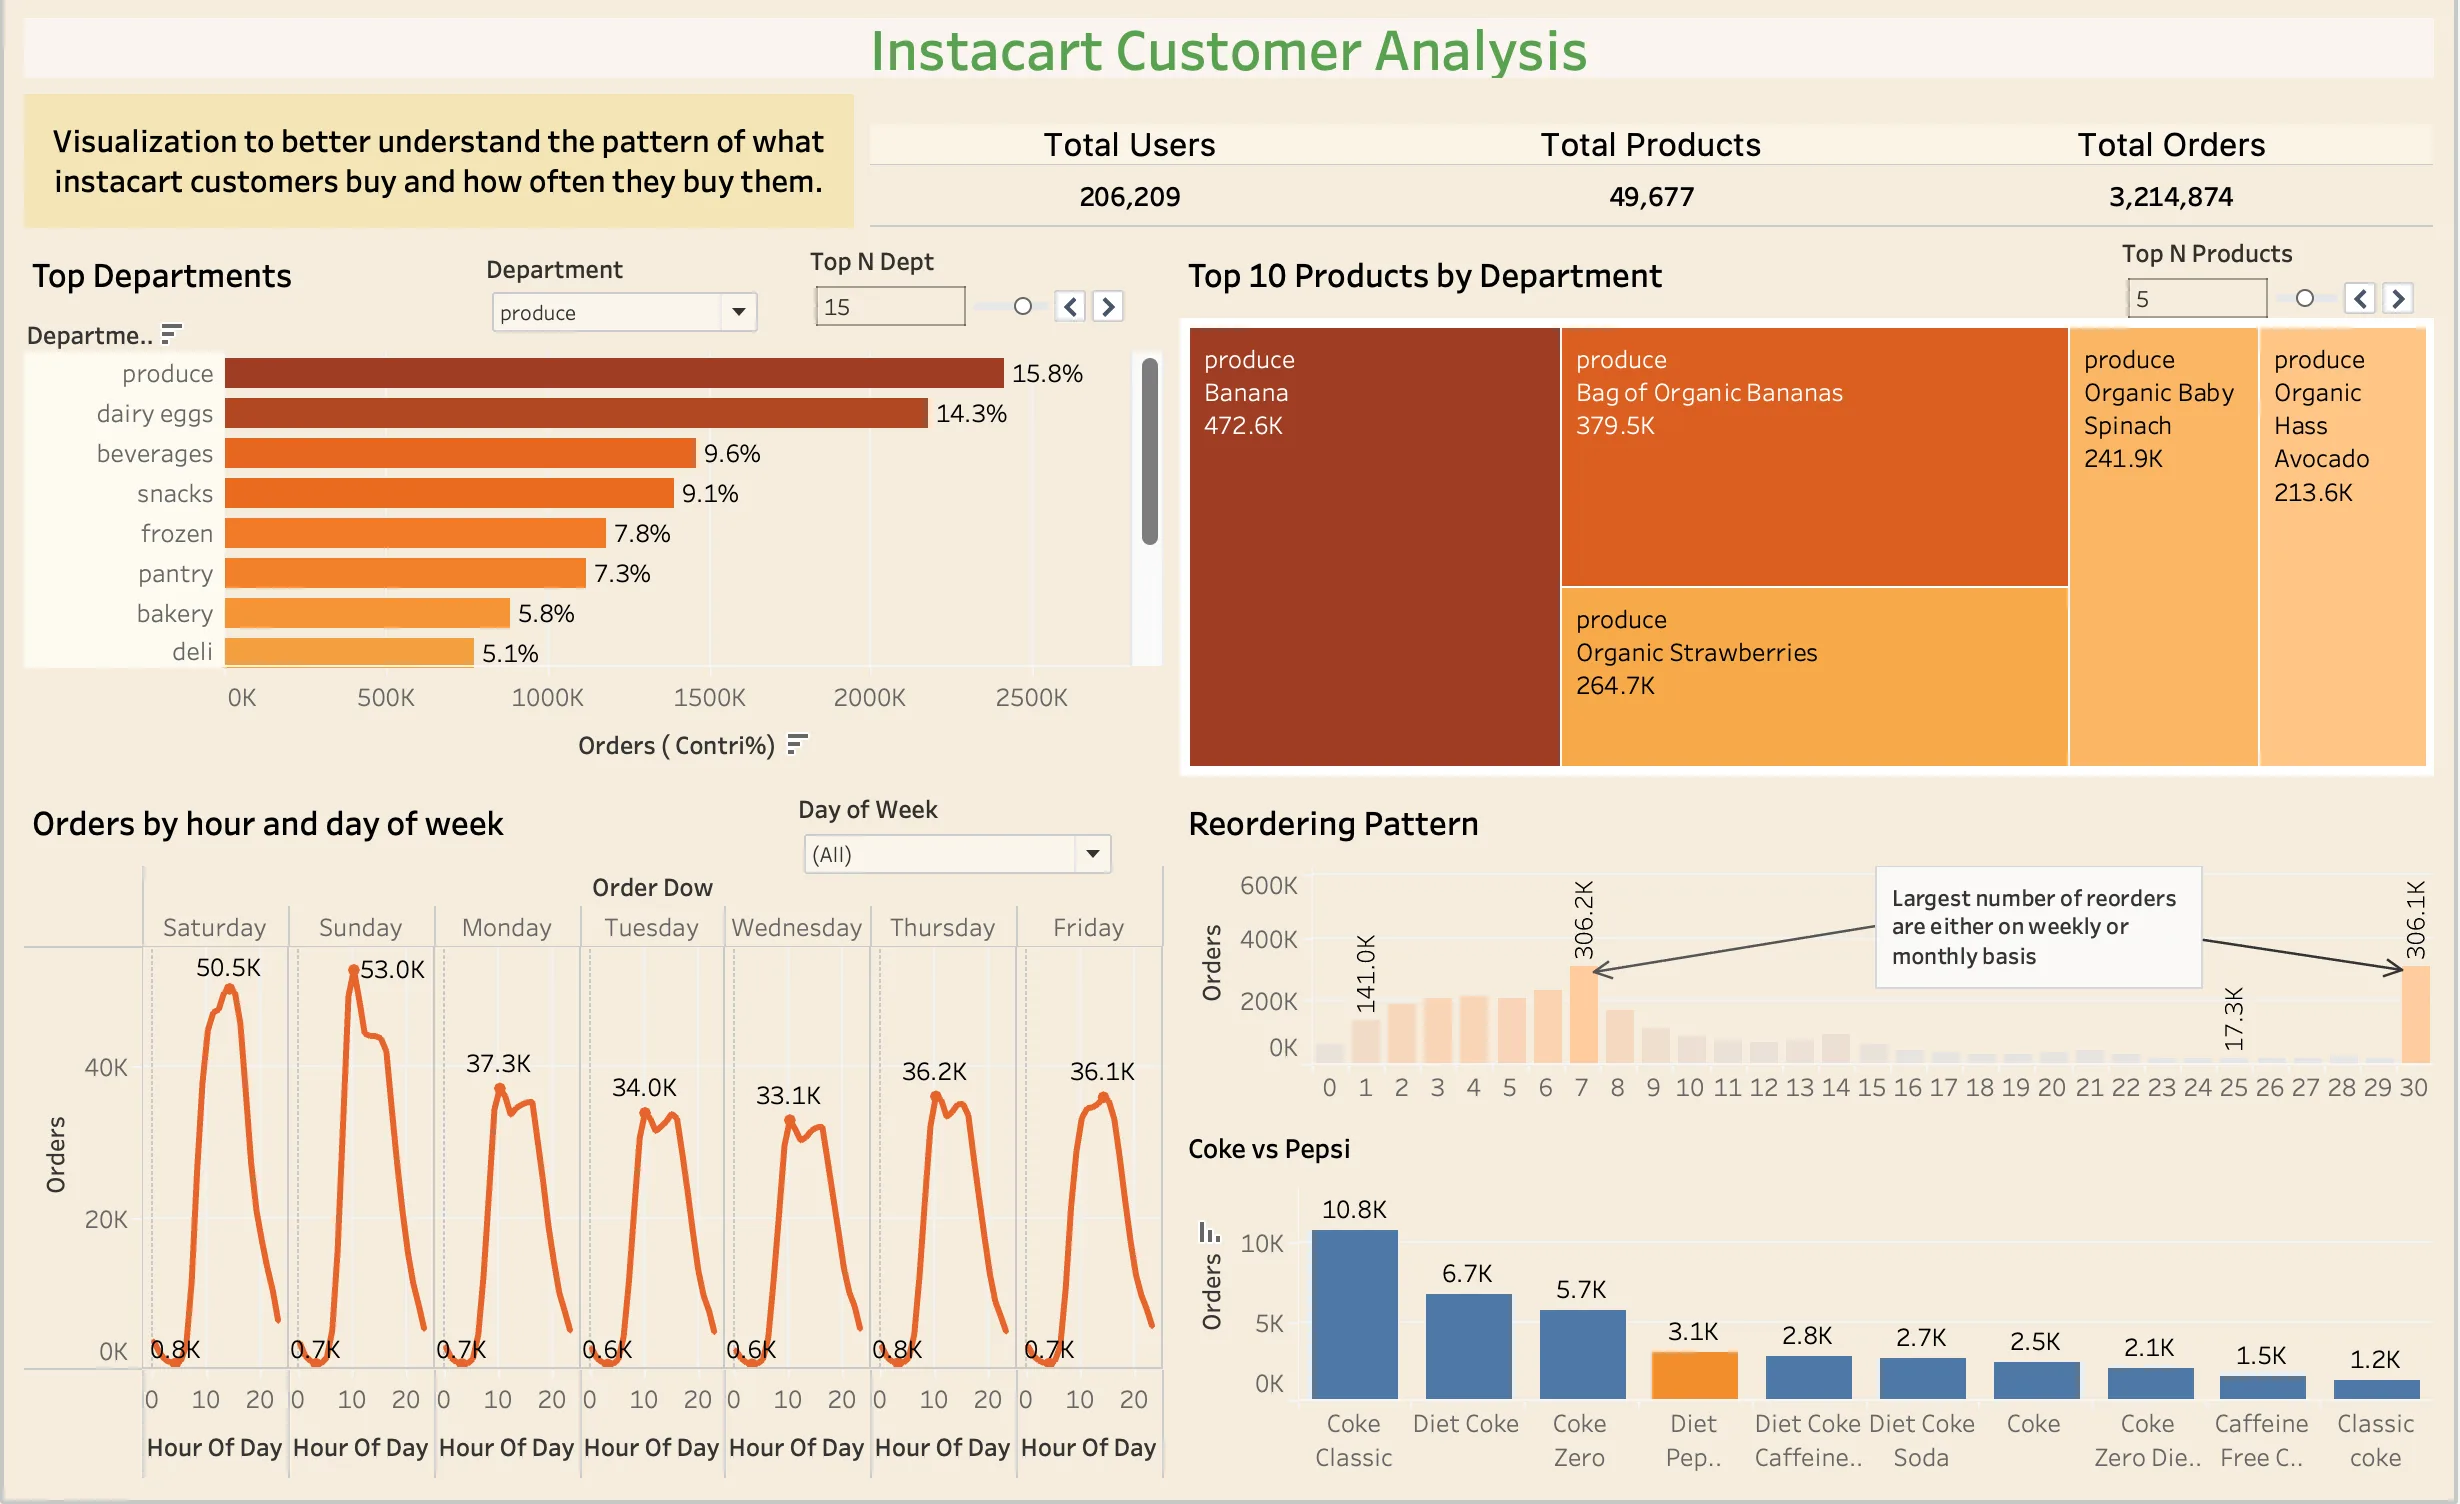
Analysed 3.4M grocery orders from 200K Instacart users to uncover buying patterns using SQL, Python, and Tableau.
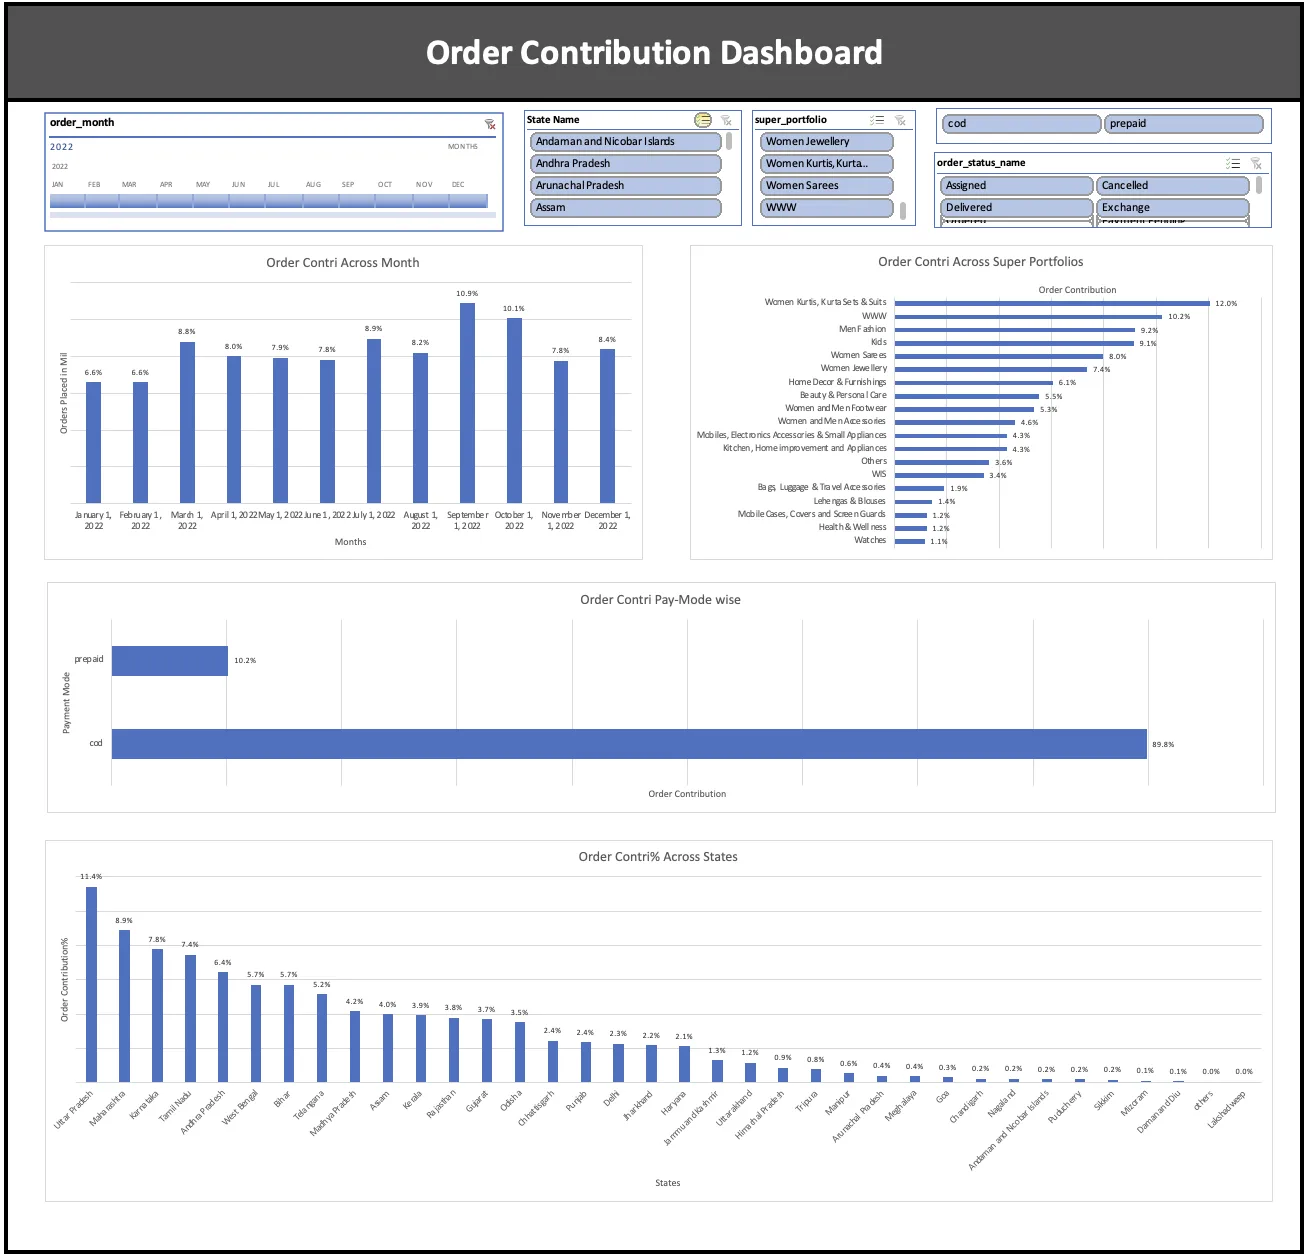
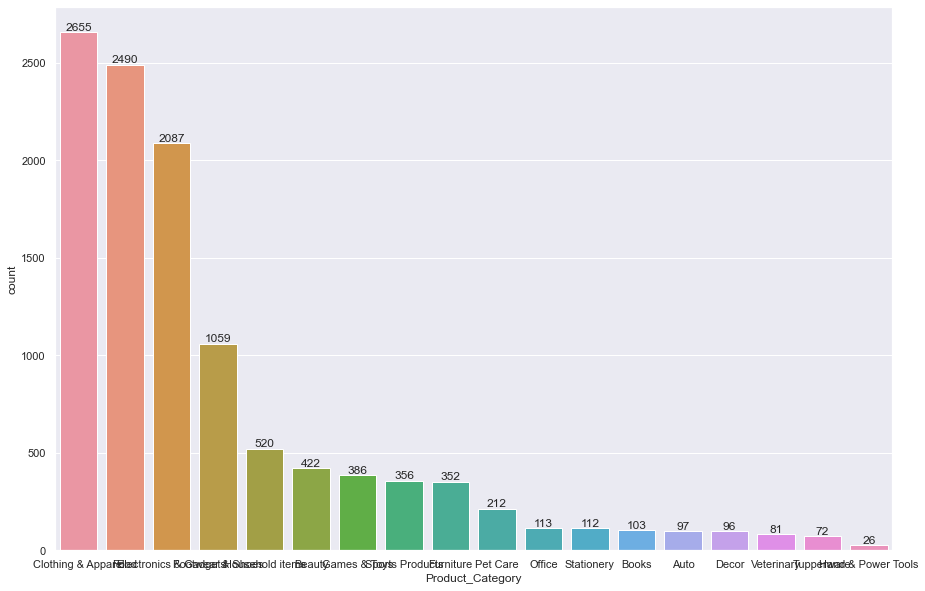
Examined e-commerce sales data, detected seasonal trends, and identified patterns in KPIs across categories and payment modes.
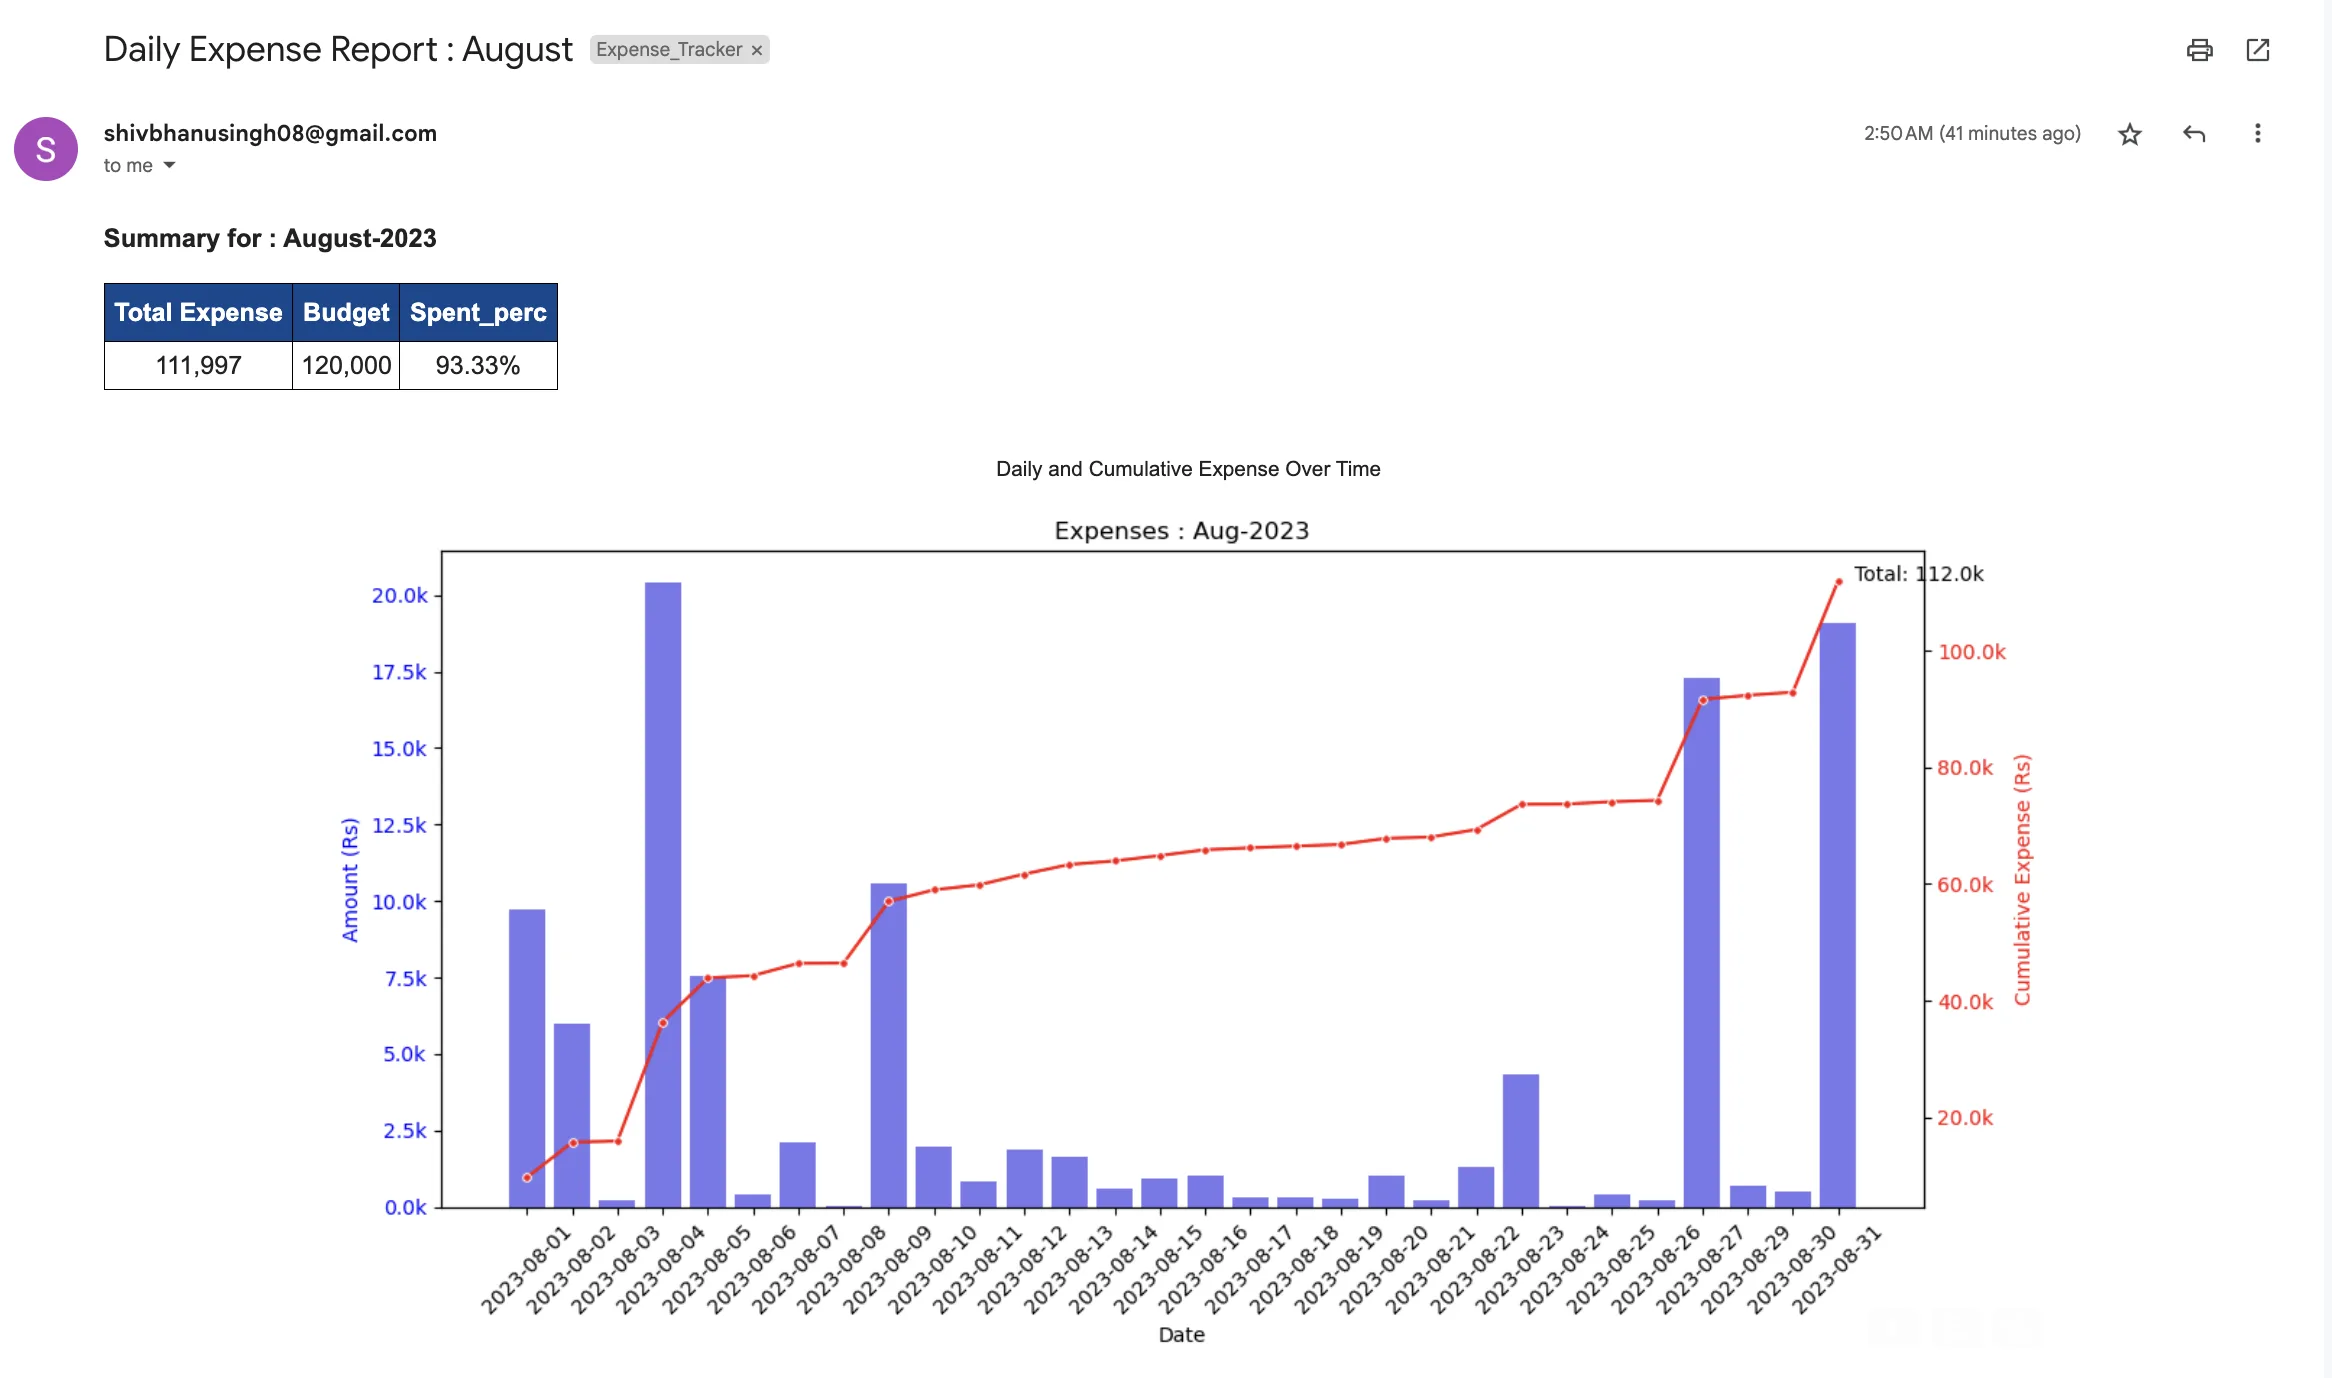
Built an automated expense dashboard that parses bank transaction emails and delivers structured monthly insights via Python.
Used Python to identify key customer cohorts - by age, gender, geography - driving sales during the Indian festive season.
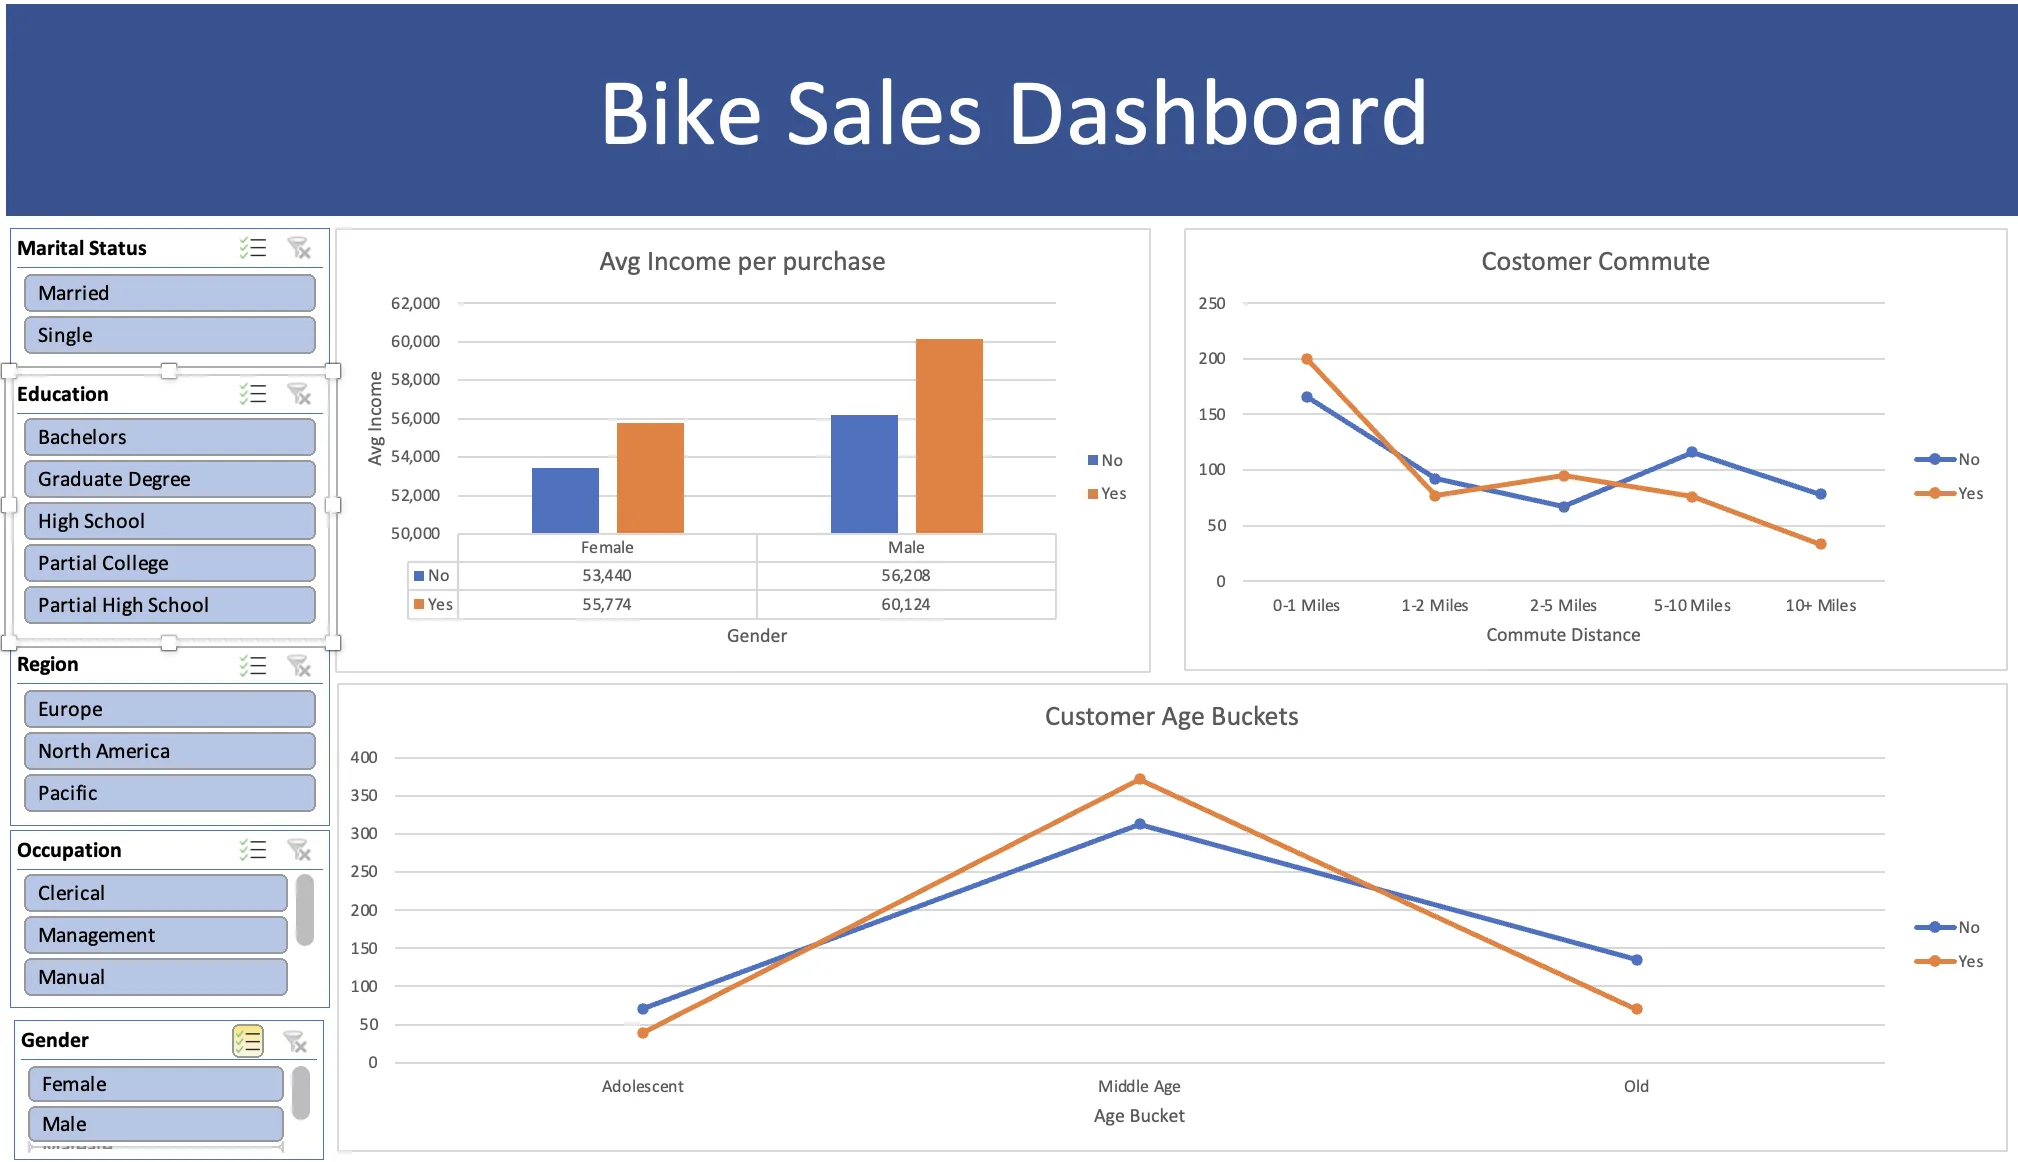
Excel dashboard exploring customer demographics - age, income, region - and their influence on bike purchase decisions.
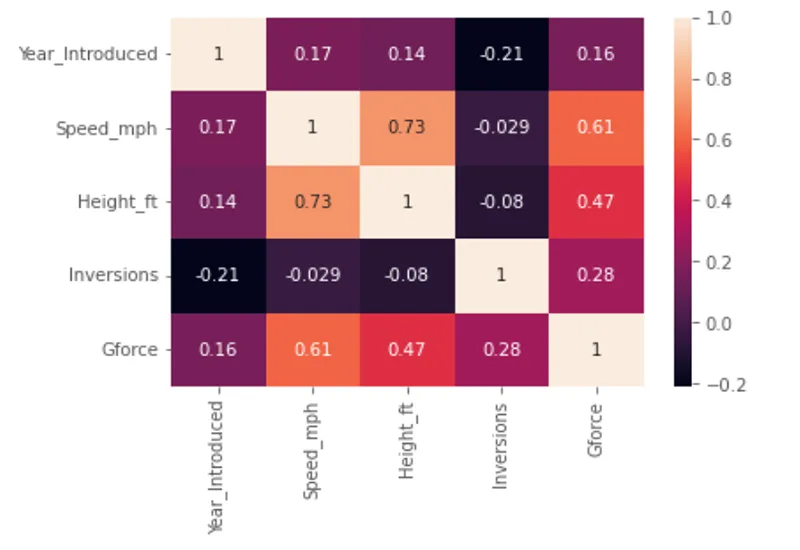
Exploratory data analysis on ~1,200 US roller coasters covering data preparation, feature correlation, and speed distribution patterns.